Cohorts
Calculate the risk score for each data instance and stratify into high and low-risk cohorts.
Inputs
- Data: reference survival dataset
Outputs
- Data: reference data set augumented with two new variables, one with the computed risk scores and a binary variable stratifying instances into low and high-risk
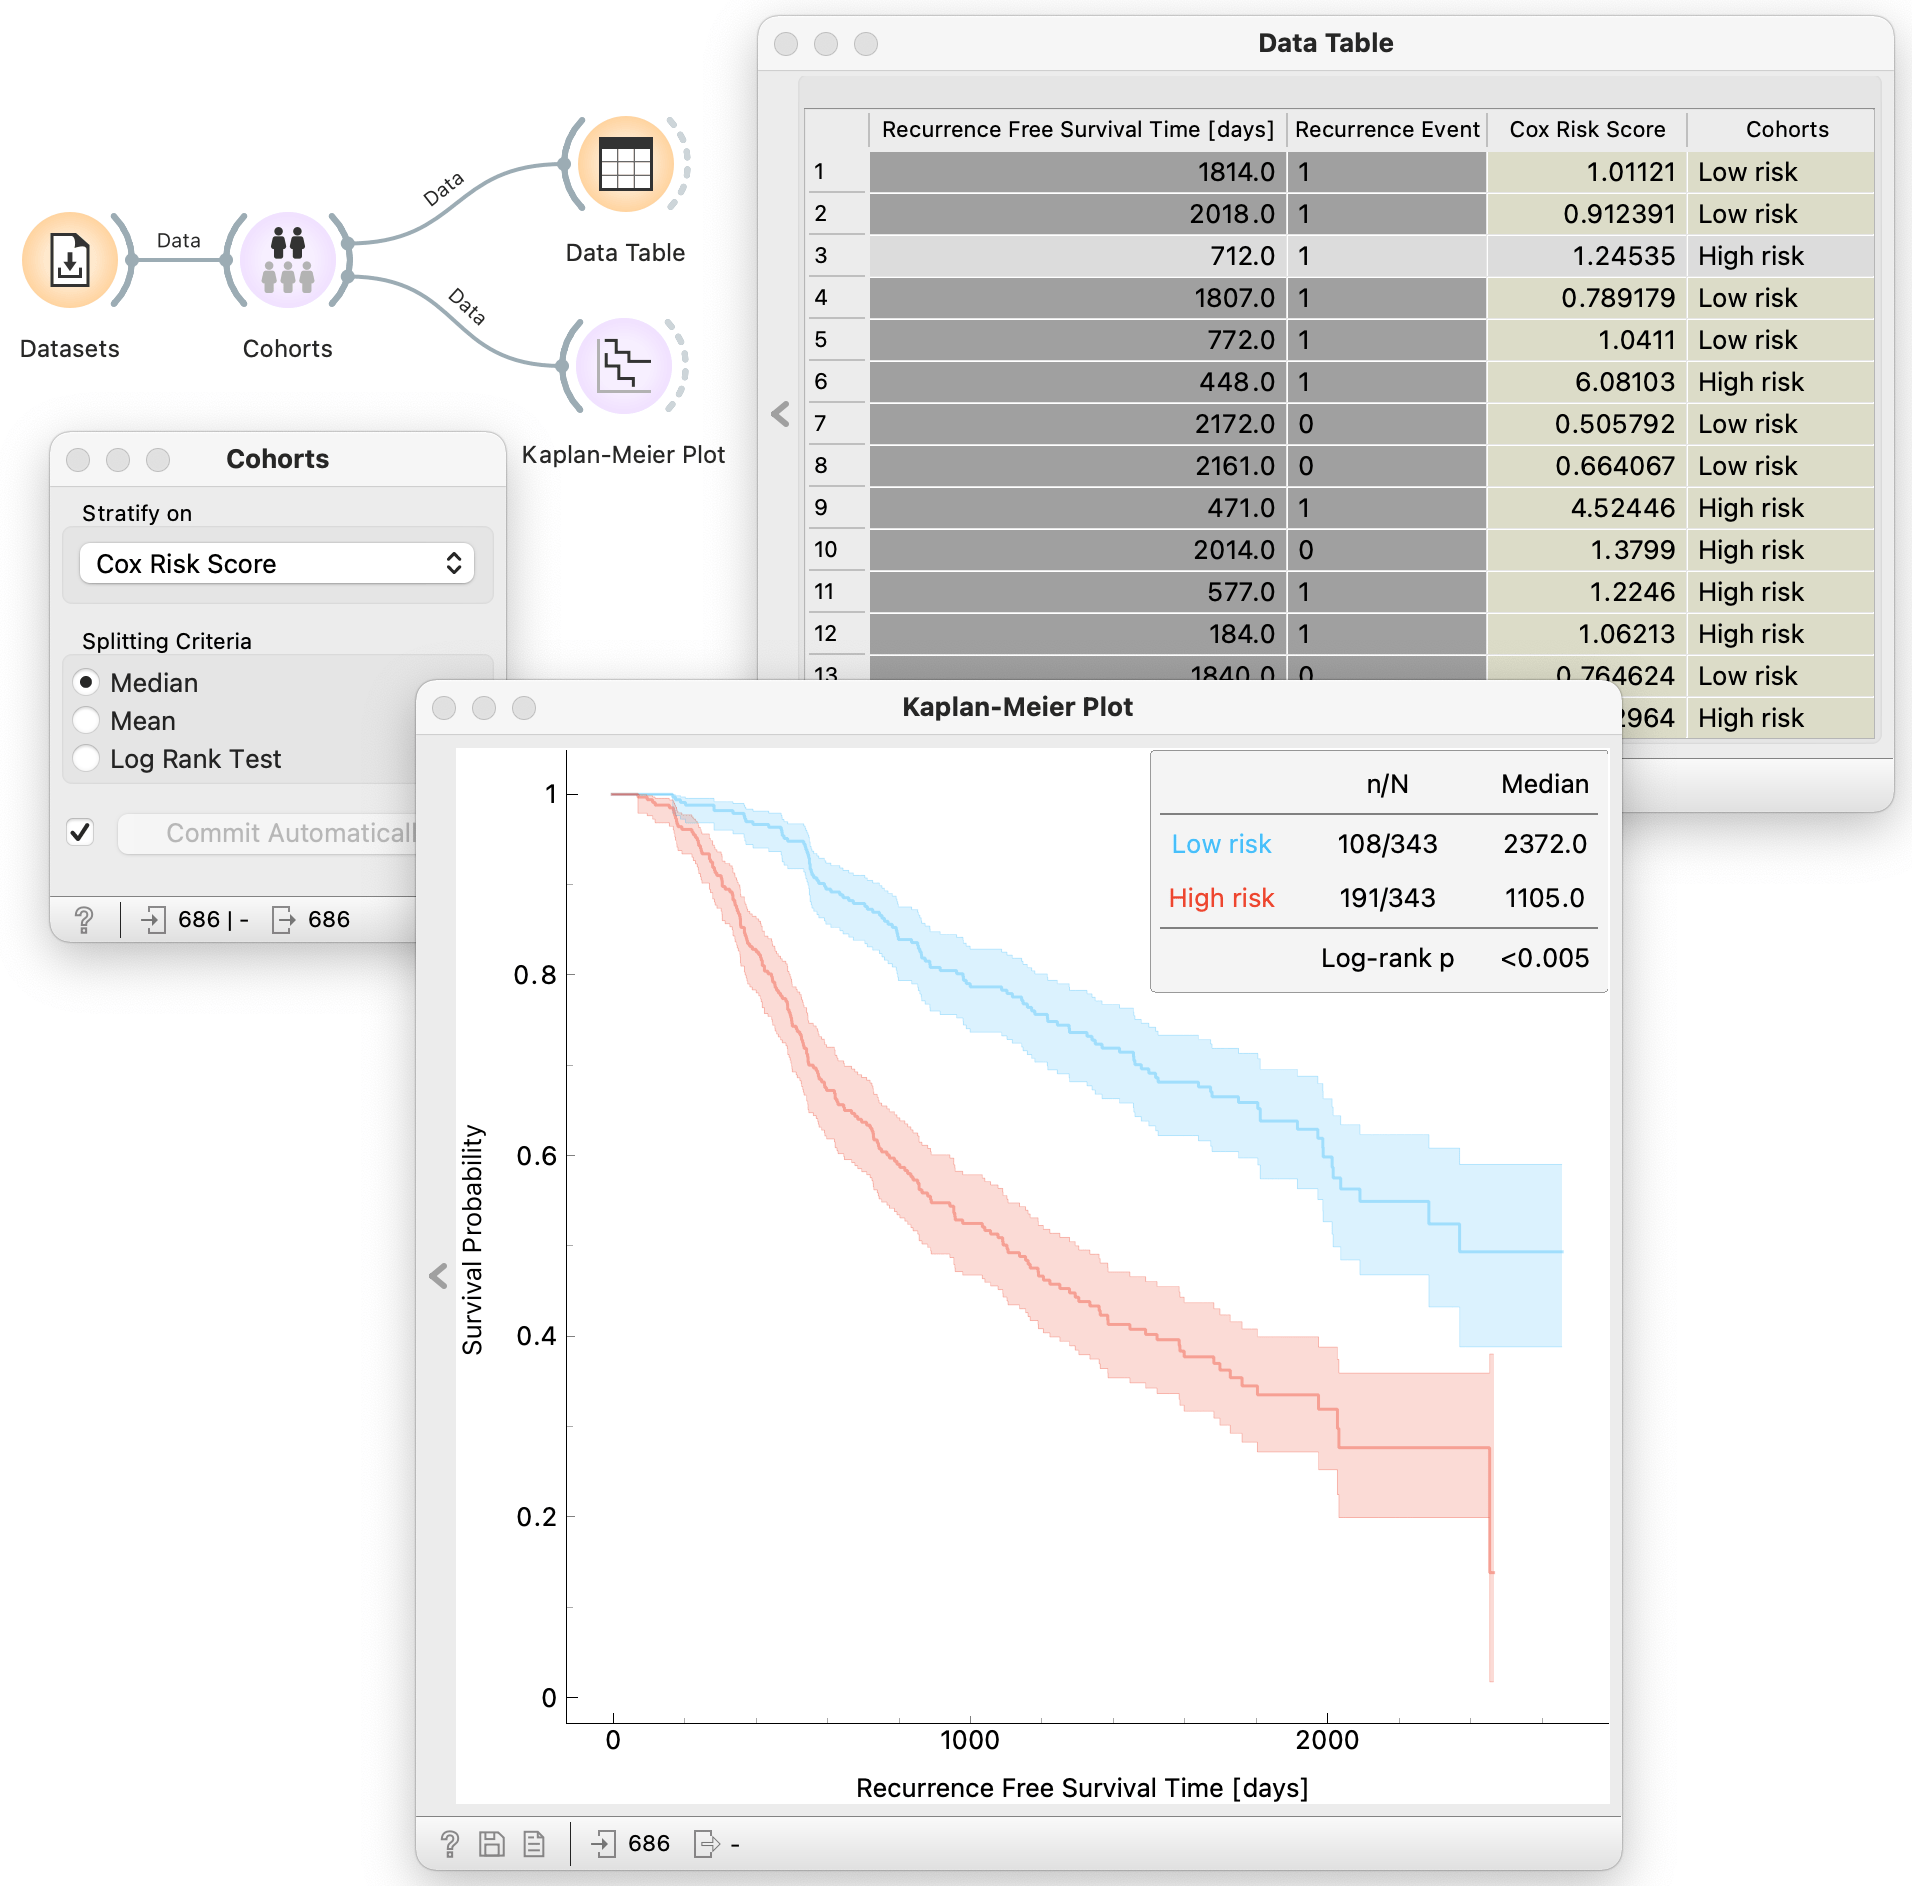
Cohorts is a widget that receives a survival dataset and assigns a risk score to each data instance. The risk score is derived from the fitted Cox regression model. The widget augments the output dataset with a continuous variable that stores computed risk scores and a binary variable stratifying data instances into high and low-risk groups. Stratification is based on defining a threshold using either the median, the mean or log rank test.
Example
In the example below we load the already available German breast cancer study group 2 (German BC2) dataset using the widget Datasets. We input the survival data to the Cohorts widget and select what kind of spliting criteria we want to use to stratify the data instances into low and high-risk cohorts. Here we choose the threshold to be the meadian. The defalut Orange setting is set to commit automatically, so the widget immidiately starts calculating the risk score derived from the fitted Cox regression model. We can then inspect the calculated risk score and derived binary stratification in tabular form using the Data Table and visualize the estimated survival curves for the high and low risk cohorts using Kaplan-Meier Plot.
